Sonalake
Nominated Award:
Best Application of AI in an SME
Website of Company (or Linkedin profile of Person):
www.sonalake.com
Sonalake is a software partnering company that helps enterprises to innovate using software. We reinforce existing know-how and data with cutting-edge analytics, automation and visualisation technologies.
Sonalake has deep domain expertise in telecommunications. Over nearly 20 years, Sonalake and its predecessor organisations have delivered over 400 projects to large and small network operators across the globe. We have deployed innovative web-scale telecom management solutions globally with clients such as Vodafone, BT, eir, enet and Three.
One area of particular focus for us is Network Service Analytics. In 2016, we established a dedicated Analytics Practice within Sonalake to consolidate and further develop our expertise in the area.
The Analytics Practice Team grew from just eight people to 40+ specialists and provides strategic advice, systems integration and product solutions to operators and vendors, addressing the most demanding challenges facing the industry.
The team helps enterprise clients analyse how their underlying data can be translated to provide insights and democratised to provide access across relevant user groups.
The team excels in three main areas:
• Analytics Applications
Custom development of applications that cannot be fulfilled by available COTS products, including embedding analytics modules within vendors’ software products.
• Data Visualisation
Advisory services on the design and presentation of analytics outputs – primarily dashboarding and reporting – based upon expertise in user experience (UX) and the available tooling, including commercial BI and open source software products.
• Data Science
Advisory and development services for advanced analytics features based upon contemporary machine learning and data science capabilities.
The team has experienced lots of successful customer projects across market verticals and its efforts were recognised for the impact of their work in transforming data and visual analytics in the telecoms vertical. These include a major Data Analytics Enterprise Platform for Travelport, and a Data Visualisation and Executive Dashboarding solution that has been adopted by several large brands in the telecommunications vertical.
Reason for Nomination:
Since we live in a 24/7 connected world, it’s obvious that one of the imperatives for telecom operators is to provide smooth service and to maintain quality. Everybody remembers the prolonged Facebook outage on October 4, 2021, which prevented users around the globe from reaching its services. At the same time as the Facebook outage, some telecom operators noticed unusual behaviour on their networks. Although there were clearly some unusual patterns on the network, no simple alarm thresholds that were in place were raised as the traffic had declined gradually. By training an appropriate anomaly detection model, we see that appropriate alarms are raised right after the unusual behaviour first occurred and these data points identified correctly as anomalous.
The Facebook outage event is worth noting because customers approached us to determine if our anomaly detection solution would have detected these anomalous events on the network. They did not have the capability to raise alarms fast enough to spot this anomalous behaviour. We have taken a different approach with the aim to detect anomalies faster, even when there are slight but significant deviations from typical behaviour. By detecting anomalous events in a timely manner, the anomaly detection solution gives more time to people from business and operations to mitigate the risk of significant decrease in quality of service.
Dataset:
Having access to a large portion of the client’s historical network data, we extracted the records of KPIs on a five minutes basis. The main focus of this particular case was to detect any anomalies on both input and output throughput per each network entity (interface/link).
The initial data resolution was five minutes and the client requested that we keep it at that level of granularity. That required us to provide diagnostics for each KPI of interest at five minute intervals for all links.
Model:
This meant training five models that account for learning the behaviour of all 260+ entities. Another advantage of performing clustering was that it allowed us to track the entity or interface’s pattern of behaviour over a period of time. An interface should always belong to the same cluster if its behaviour or pattern does not change. Any deviance of an interface from its assigned cluster signifies a trend change for the interface and is notified to the operator.
Anomaly detection model at its core consists of multiple CNN autoencoder models. The autoencoder approach works by tryings to learn how to first compress input features to a latent feature space. Then, by decompressing it, it learns to reconstruct features to its original values as perfectly as possible. Since the model is trained on non anomalous data instances only, this means that it will learn to almost perfectly reconstruct the original input values.
In a production environment, where the model can eventually see anomalous points in data, it won’t be able to reconstruct it as it hasn’t learned such patterns previously. Whenever the model is unable to reconstruct the sequence, it generates a relatively high (compared to when the model has previously seen the sequence during the training phase) reconstruction error which is calculated by subtracting original and reconstructed values. The reconstruction error, also known as ‘anomaly score’, indicates how well the sequence was reconstructed.
In an ideal world, the loss should be very close to zero. Higher reconstruction loss leads to higher anomaly scores which indicates that the model has not seen the sequence before and therefore it is unable to reconstruct it properly. This indicates that the sequence may contain anomalous points.
Description of AI Solution
The final decision on anomalous events is made by taking into account anomaly scores (reconstruction errors) per point currently observed and the recent history of anomaly scores per particular entity-KPI combination. We calculate the rolling standard deviation of the anomaly scores in a window of appropriate time stamps (anywhere between 12 to 24 hours) and then make use of the +3sigma and -3sigma as the decision boundaries for determining anomalous points.
If the anomaly score breaches these bands, we term the point as an anomaly. In this way, we were able to create upper and lower decision boundaries and decide whether each point is labeled as anomalous or not. The approach taken to solve this problem consists of modelling the data on two main levels. The first one is to cluster the entities and the second one is training the CNN Autoencoder for time series data in order to detect anomalous points.
We choose to perform clustering of entities because the network consists of 260+ entities and clustering allows us to identify groups of interfaces that behave similarly. We can then build a model for each of the groups identified, reducing the number of models needed to be trained and maintained.
Here, the segmentation or clustering was done using K- Means clustering algorithm with Dynamic Time Warping to identify clusters based on the behaviour of the interfaces during the 24 hours with daily seasonality. The algorithm identifies the entities or interfaces in the network that show a similar behaviour during the 24 hours of the data. We were able to identify five unique clusters in the network.
Additional Information:
Organisational Impact
Figure 1 below represents an example output of the anomaly detection module.
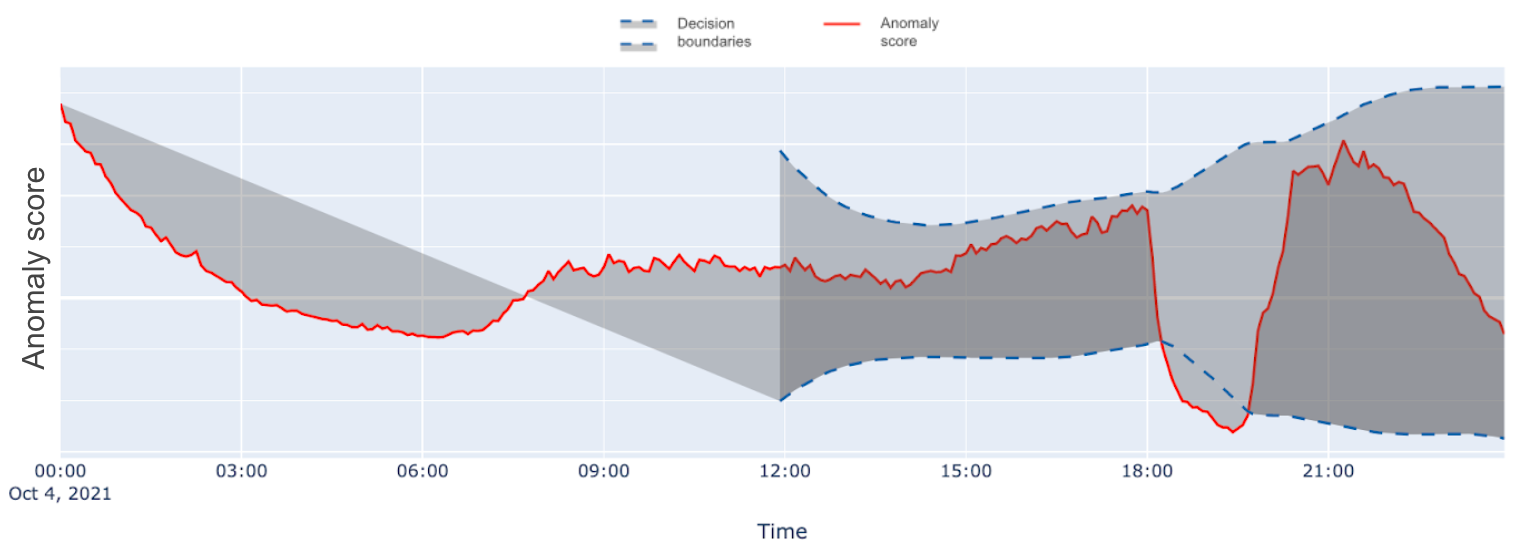
Figure 1 shows the upper and lower decision boundaries that the model calculates based on the standard deviation. The anomaly score should always stay within the decision boundaries. In Figure 2, the anomaly score breaches the lower decision boundary at 18:00 hours, indicating that the model has not seen such a drop in KPI and raising an alert in near real-time.
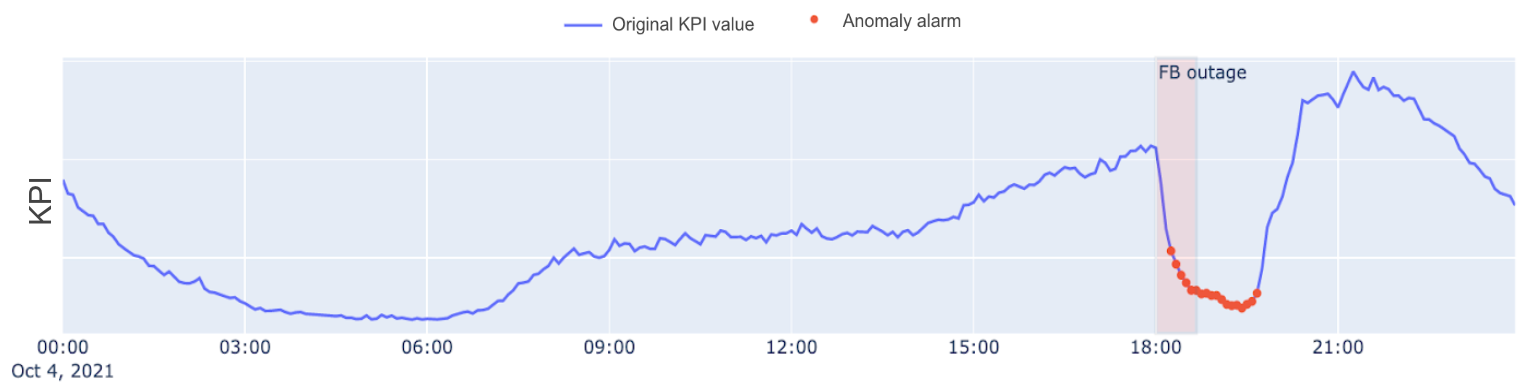
Unusual network behaviour drops in throughput or a sudden change in any significant network metric as seen in the figures above can severely affect the Quality of Service (QoS). As this can result in churn and revenue loss, it’s critical to respond to these lapses before the user experience is impacted. In the past, manual anomaly detection was a viable option. There were only a few metrics an organisation needed to track across the network, and the datasets were manageable for an analytics team. However, now there is more data than ever, and traditional, manual anomaly detection doesn’t scale.
Our solution is designed to automate anomaly detection and to provide accurate, real-time insights regardless of how many metrics a network service provider might track. The model groups the data according to their behaviour (clustering) and then learns the behaviour of the network. Any deviance from the normal behaviour is identified and flagged in real time to the user, thereby eliminating the need for teams of analysts to analyse large amounts of data. Our proactive solution monitors and analyses the network data and detects subtle – and sometimes not-so-subtle – or unexpected changes whose root causes warrant investigation.
Files:
https://aiawards.ie/wp-content/uploads/ninja-forms/4/Sonalake-AI-Awards-2022-Real-Time-Anomaly-Detection-in-Telecoms-1.pdf