Sonalake
Nominated Award: Best Use of AI in a Consumer/Customer Service Application
Website of Company: www.sonalake.com
Sonalake is a software partnering company that helps enterprises to innovate using software. We reinforce existing know-how and data with cutting-edge analytics, automation and visualisation technologies.
Sonalake has deep domain expertise in telecommunications. Over nearly 20 years, Sonalake and its predecessor organisations have delivered over 400 projects to large and small network operators across the globe. We have deployed innovative web-scale telecom management solutions globally with clients such as Vodafone, BT, eir, enet and Three.
One area of particular focus for us is Network Service Analytics. In 2016, we established a dedicated Analytics Practice within Sonalake to consolidate and further develop our expertise in the area.
The Analytics Practice Team grew from just eight people to 40+ specialists and provides strategic advice, systems integration and product solutions to operators and vendors, addressing the most demanding challenges facing the industry.
The team helps enterprise clients analyse how their underlying data can be translated to provide insights and democratised to provide access across relevant user groups.
The team excels in three main areas:
• Analytics Applications
Custom development of applications that cannot be fulfilled by available COTS products, including embedding analytics modules within vendors’ software products.
• Data Visualisation
Advisory services on the design and presentation of analytics outputs – primarily dashboarding and reporting – based upon expertise in user experience (UX) and the available tooling, including commercial BI and open source software products.
• Data Science
Advisory and development services for advanced analytics features based upon contemporary machine learning and data science capabilities.
The team has experienced lots of successful customer projects across market verticals and its efforts were recognised for the impact of their work in transforming data and visual analytics in the telecoms vertical. These include a major Data Analytics Enterprise Platform for Travelport, and a Data Visualisation and Executive Dashboarding solution that has been adopted by several large brands in the telecommunications vertical.
Reason for Nomination
Global increase in the use of mobile Internet service has skyrocketed over the last few years. In the competing landscape, Quality of Service (QoS) becomes a significant driver of customer churn. This application highlights some of our work to forecast Received Signal Level (RSL), one of the most important mobile Internet QoS indicators, based on time series analysis and considering external information about weather conditions such as temperature, humidity and precipitation due to the effect they cause on mobile Internet QoS.
We report descriptive statistics and classification results predicting normal vs. bad QoS for one of the leading mobile operators in Ireland up to seven days in advance. Our results illustrate that by combining network features (such as antenna height, distance of transmission) and non-network weather features, we are able to predict the QoS with an accuracy of 84% for the next seven days. This allows network operators to take corrective actions to improve the QoS.
Description of Challenge
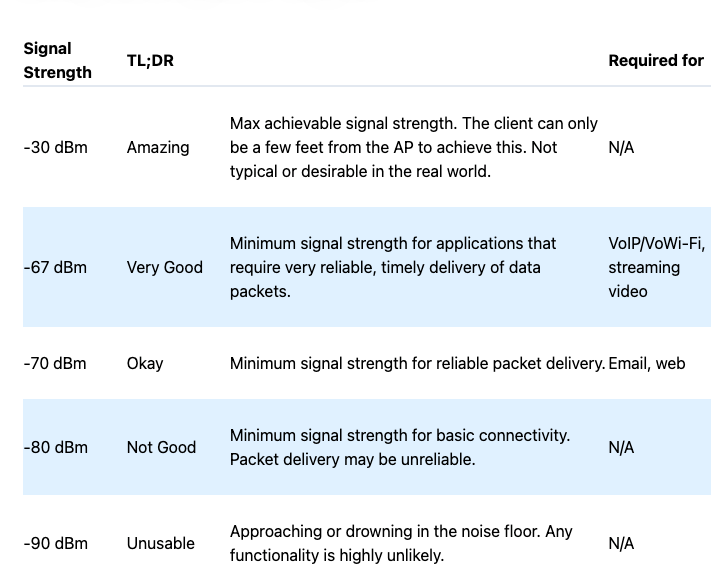
Received Signal Level (RSL) is one of the most important quality of service (QoS) indicators, mainly because it directly influences other QoS indicators such as latency, number of lost packets and throughput. RSL is a measurement of how well the receiver can hear a signal from a transmitter or router. The numbers are always preceded by a minus (-) sign and the closer to zero the reading is, the stronger the signal will be. The following chart shows the significance of RSL as a QoS parameter.
Predicting the future values of the RSL can assist the network operators to maintain optimal network performance and prevent Qos violations before they happen. We worked closely with one of the leading mobile operators and the domain experts to build a solution that predicts the QoS violations based on RSL drop up to seven days prior.
Outline of Innovative Business Solution
Dataset Overview:
To do this we used three months’ worth of real world dataset from a mobile operator in Ireland. The dataset consisted of more than 15 million records in the form of the daily snapshots of the maximum and minimum RSL for over 16,000 transmission links spread all across the island. The dataset also contained descriptive network data such as the types of transmitting antenna, height of antenna, the precise geolocation of the transmitting and receiving antenna etc.
In addition, we also used the weather data for the location of each of the transmitting and receiving antenna using the coordinates from an online weather service using an API that reports live and forecasted weather data for any geo-coordinate.
Model:
To forecast QoS violations for a transmission link, we converted the regression problem into a classification problem. We assigned class labels as ‘Critical’ when the RSL value was below -70 dB and ‘Normal’ otherwise. Following which, the entire time series was broken down into sequences of seven days and we calculated the following statistic on those features for seven days.
Some of the features we extracted have been listed below:
– Mean
– Standard deviation
– Average absolute deviation
– Minimum value
– Maximum value
– Difference of maximum and minimum values
– Median
– Median absolute deviation
– Interquartile range
– Number of values above mean
– Number of peaks
– Skewness
– Kurtosis
– Energy
After the class labels were assigned and the features were extracted, we tried various class balancing techniques as the dataset was skewed in favor of normal in the ratio of 39:1 (i.e. for each critical we had 39 normal classes in the dataset). To solve the issue of imbalanced class distribution we tried Synthetic
Minority Oversampling Technique (SMOTE) and undersampling and found that controlled undersampling of the majority class was the most efficient solution in terms of performance and scalability.
After Data set preparation, for the modeling phase we used the XGBoost model given its scalable nature and its ability to handle imbalanced data.
Detail on Analytics-Based Approach
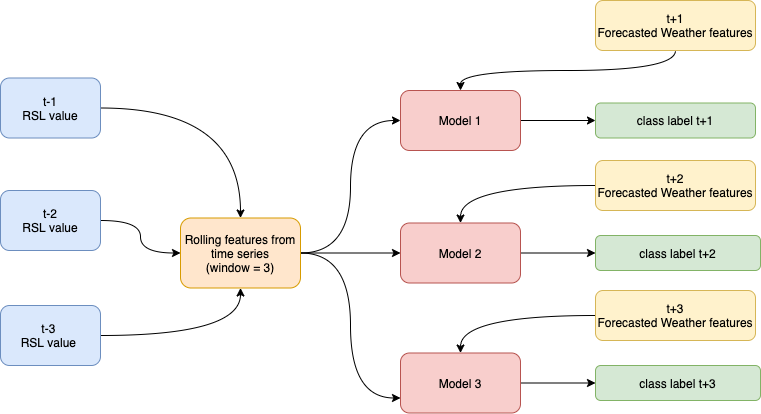
We needed to forecast the RSL values seven days in advance so that the Network operators have enough time to take corrective measures when the model predicts QoS violations on a specific transmission link. In order to achieve this, we used the concept of direct multi-step forecasting.
Direct multi-step forecasting consists of training a different model for each step of the forecast horizon. For example, to predict the next three values of a time series, three different models are trained, one for each step. As a result, the predictions are independent of each other.
As illustrated in the diagram we have one model for each time step ahead. Model 1 makes the predictions for time t+1 by taking the rolling features from the previous time three time steps and combining them with the forecasted weather features for the closest geo location to the receiver of the transmission link. We observed that the RSL values are drastically affected by the prevailing weather conditions such as temperature, wind, wind direction, precipitation etc., and a lot of the variation in the RSL values can be explained using the weather features.
(IMAGE: 2 – Sonalake – Predicting the impact of Weather conditions on QoS in
Mobile Networks.png)
Additional Information:
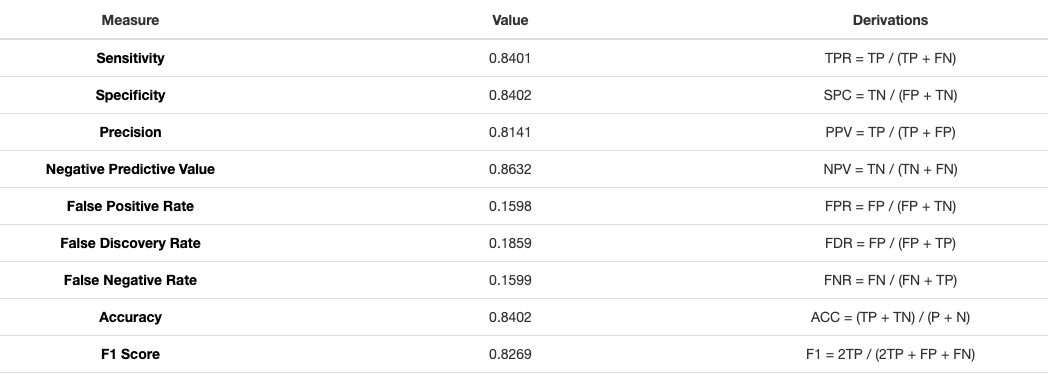
The results show that our model can predict RSL values using weather conditions. The tested model consistently obtained an overall accuracy of around 84% with precision of 81% and recall of 84%. This demonstrates that the model was consistently able to detect 84% of the total QoS violations that
occurred on any given link.
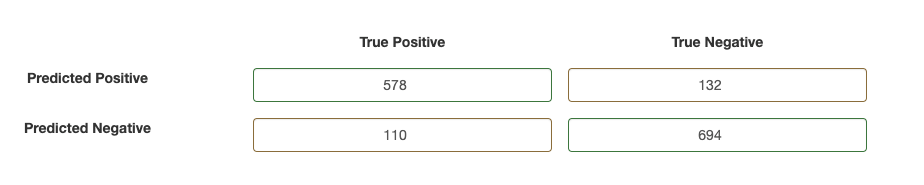
The Chart below shows the confusion matrix and features the following terminologies:
– Predicted positive: The Model predicted QoS issue due to RSL threshold
breach
– Predicted negative: The Model predicted no QoS issue
– True positive: The transmission link faced a QoS issue due to RSL threshold
breach in reality
– True negative: The model predicted no breach and there was no breach
The results provide empirical evidence supporting the fact that weather conditions impact on mobile phone quality of service, and specifically on RSL.
The model uses advanced feature engineering and modeling techniques to predict the QoS issues that the operators might experience on their Network up to a week in advance. This gives them ample time to plan preventative maintenance activities and potentially avert these issues.
With our model developed, we now plan to integrate this functionality into VisiMetrix so that our customers can reap the benefits of forecasting on their production dashboards. We’re looking forward to seeing it in action in the wild on 2G, 3G, 4G, 5G networks.